HI
Tuesday, 24 April 2018
Sunday, 22 September 2013
SPSS ( Standard Deviation and Variance)
Finding out Standard Deviation and Variance
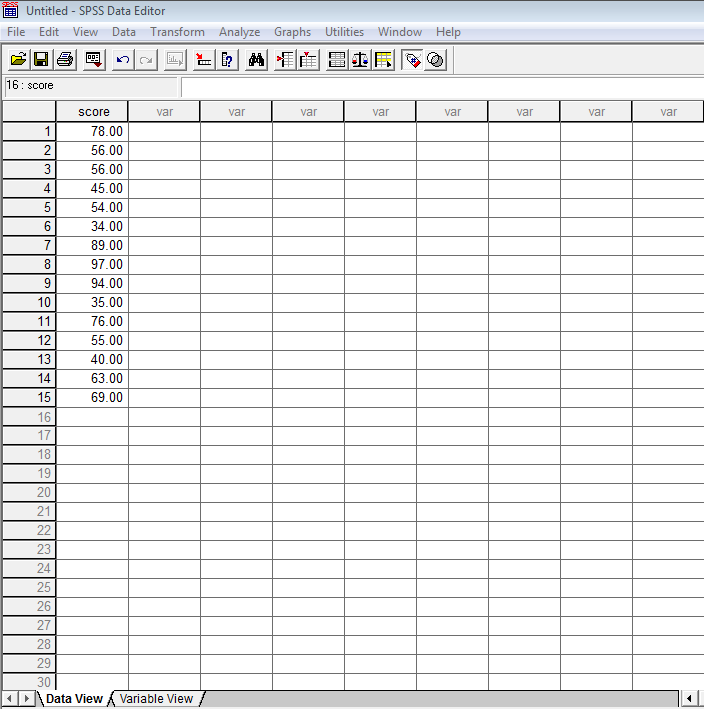
Go to Variable view ---> In the name column enter Score ---> Keep rest options filled automatically---> Come to data view ---> fill in the scores for 15 students according to the requirements

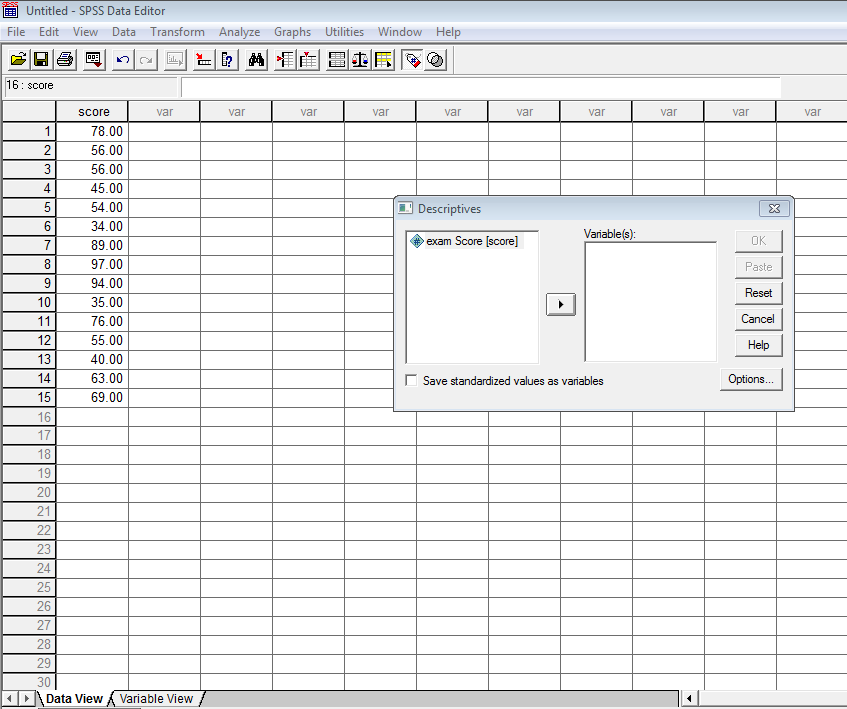
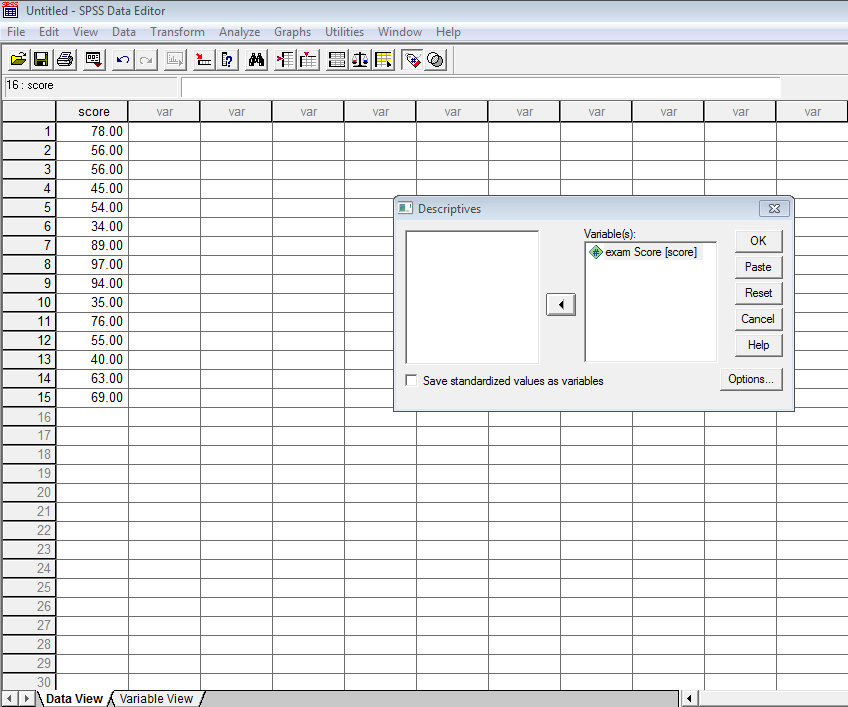
Go to Analyze ---> Descriptive statistics ---> Descriptives ---> Move the variable from left box to the right box ---> Go to options and then deselect mean as we don't require it ---> Then under dispersion select minimum and maximum ---> Select range and variance ---> Select Standard Deviation ---> Continue ---> ok


You can find Standard deviation and Variation through frequencies also...


Go to analyze ---> Descriptive Statistics ---> Frequencies ---> Move the variable from left to right box ---> Statistics ---> Deeselect Select Frequency table check box--->Select Standard Deviation ,Range,Mininmum and Maximum and Variance ---> continue and Ok


Next post will show Annova .
Ramesh
Wednesday, 18 September 2013
SPSS ( Coefficient of Correlation)
Today I want to discuss Coefficient of correlation
Go to Variable view ---> Under Name put Score ---> Take GPA as second name ---> Leave the rest fields it will be filled by default ---> Move to Data view ---> Fill the data under Scores and GPA as shown below---> Click ok.


The order of the scores really doesn't matter as long as each pair stays together.
Go to analyze---> Correlate---> Bivariate ---> Now shift the variables which you want to correlate from left window to the right window ---> Under Coefficient correlation select Pearson check box ---> Select two tailed under Test of significance and Flag significance correlation.


Analysis and interpretation
In the first square we see the correlation 1 which is a perfect correlation in the same way in the second square we can see the perfect correlation 1 between Scores and GPA.
If we see the correlation between Scores and GPA is very high ,it is almost 1.Below that we can see the significance value that is very small.It is definitely less than 0.0 or 0.01. We should know that any value below 0.05 significant. Never think the correlation and the significant values are the same, they are not.
Hope it was useful .
Ramesh
Thursday, 12 September 2013
SPSS ( Building Bar charts,Pie charts)
Today I am posting about creating bar charts,Pie charts and Histogram which are the very important to analyse the given data very easily .
Here the data is given for color of T-Shirt . So we are going to prepare a Bar chart and Pie Chart with the same data.
Open SPSS ---> Go to Variable view ---> Type Shirt in the Name column and String in the Type column as we are dealing with words here. In the label you can write color of T Shirt and rest column keep as it is.


After entering the data now go to Analyze ---> Descriptive statistics --->Frequencies---> Now shift the Color of T shirt variable from left box to the right box---> Click on charts ---> Select Bar chart and follow the same path for Pie chart and instead of selecting Frequencies select Percentage in case of Pie chart . Below diagram shows the variable I have shifted from left to right. For this variable we are making the Bar and Pie chart.

Now click charts tab in that dialogue box and select Bar chart and select Frequencies which is given just below under chat values. Then click continue and ok.

Now below is the Bar chart appearing .
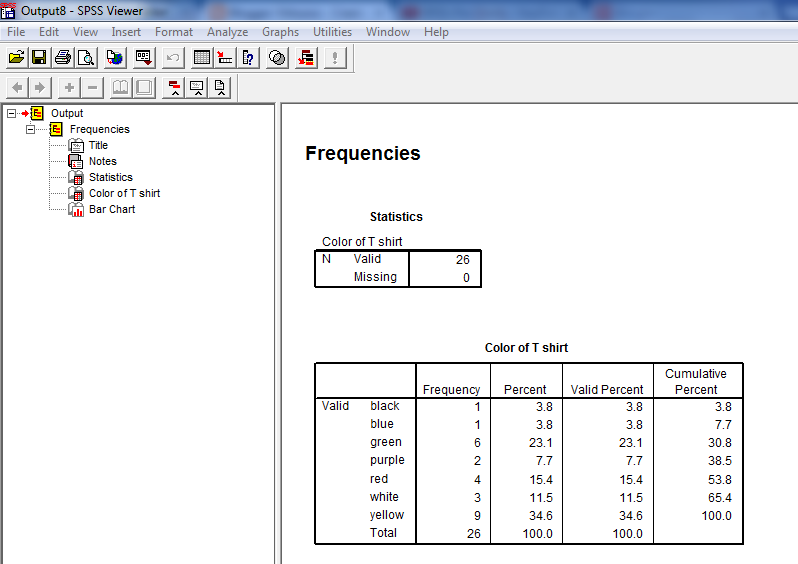


By seeing the pie chart and Bar chart you can easily analyse and interpret the result.
Hope this was helpful. In my next post will show the calculation of Coefficient of Variation.
Ramesh
Tuesday, 10 September 2013
SPSS Tutorial
SPSS
This is a very important tool for analyzing data. Most of the companies are using these tools. So I think one should be proficient in knowing this tool. So I am providing the SPSS tutorial which is required in a company and helps you to be in the competition by knowing this tool.

A Brief Explanation


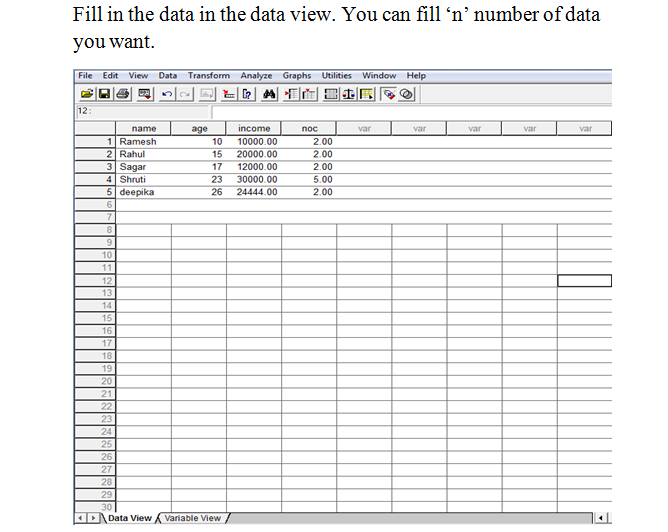


In my next post I will be showing the graphs,Histogram,Pie chart. I hope this will be useful.
Ramesh
Subscribe to:
Comments (Atom)